Though it be but little, it is fierce!
How the Preventive Health and Health Services Block Grant Bridges Gaps for Innovative, Community-Informed Public Health Interventions:
A Click-Through Story

The US Public Health System has a long-standing history of underinvestment, leading to a reduction in quality of life for individuals and communities. 1
An ill-equipped, under-resourced health department cannot function effectively.
This leads to slow disease tracking allowing disease like foodborne illness to spread faster; and costly chronic disease management that could have been prevented.
Agencies require flexibility to tackle unique and emerging public health problems including investment in public health infrastructure and capacity.
These investments enable health departments to provide essential public health services and to respond to emergencies so that communities can thrive.


Recipient Reflections
![An illustrated gif where a speech bubble with a quote appears it reads: “the nature of the block grant dollars themselves is [to be] a facilitator.”](images/bubble1.gif)
![An illustrated orange speech bubble that reads: “the nature of the block grant dollars themselves is [to be] a facilitator.”](images/bubble1.png)
—PHHS Block Grant Coordinator, 2022
![An illustrated gif where a speech bubble with a quote appears it reads: “…we [have] more flexibility to use these dollars as needed as opposed to a scripted program... We have the ability to use block grant dollars have more flexibility.”](images/bubble2.gif)
![An illustrated speech bubble with a quote that reads: “…we [have] more flexibility to use these dollars as needed as opposed to a scripted program... We have the ability to use block grant dollars have more flexibility.”](images/bubble2.png)
—PHHS Block Grant Coordinator, 2022
Recipients, in collaboration with their advisory committees, use the PHHS Block Grant to address unfunded or underfunded programs that focus on the leading causes of death and disability.
The PHHS Block Grant allows recipients to identify and fund initiatives aligned with national Healthy People objectives that address vital community public health needs in a way that categorical funding may not be equipped to support.

Recipient Reflections

“[T]he block grant gave us some stability… to fully – or more fully – address the needs of families [in our jurisdiction]”
— PHHS Block Grant Coordinator, 2023
Recipient Reflections

“By definition, the block grant fund gives the recipient ability to address [and] prioritize public health needs in their jurisdiction. [We are able to] set our own goals and … implement the local strategy to address national health priorities, [such as] the response to COVID-19 pandemic.”
— PHHS Block Grant Coordinator, 2022


In some cases, this grant serves as “seed funding” for innovative projects that a state, tribal, territorial, or freely associated state health agency provides to meet otherwise-unfunded community health goals.
It allows recipients to try intentional, innovative ideas, while remaining good stewards of federal funds.
Wait— what is innovation?


The creation and implementation of a novel process, policy, product, program, or system leading to improvements that impact health and equity. It is a new or adapted solution that may be creative, untested and based on context.
Successful innovation results in improved effectiveness, efficiency, or quality.
The process of innovating, through successes and failures, will produce new learning and understanding for informed decision-making and program improvement.10
Innovation as a concept pushes the field to think of new and different ways of addressing challenges to help meet community needs.


Depending on the need, evidence-based interventions may not exist.
Innovation allows for jurisdictions to balance the current evidence-base with what they hear from their communities.
Often this form of customization isn’t feasible within the structure of categorical funding.
Recipient Reflections

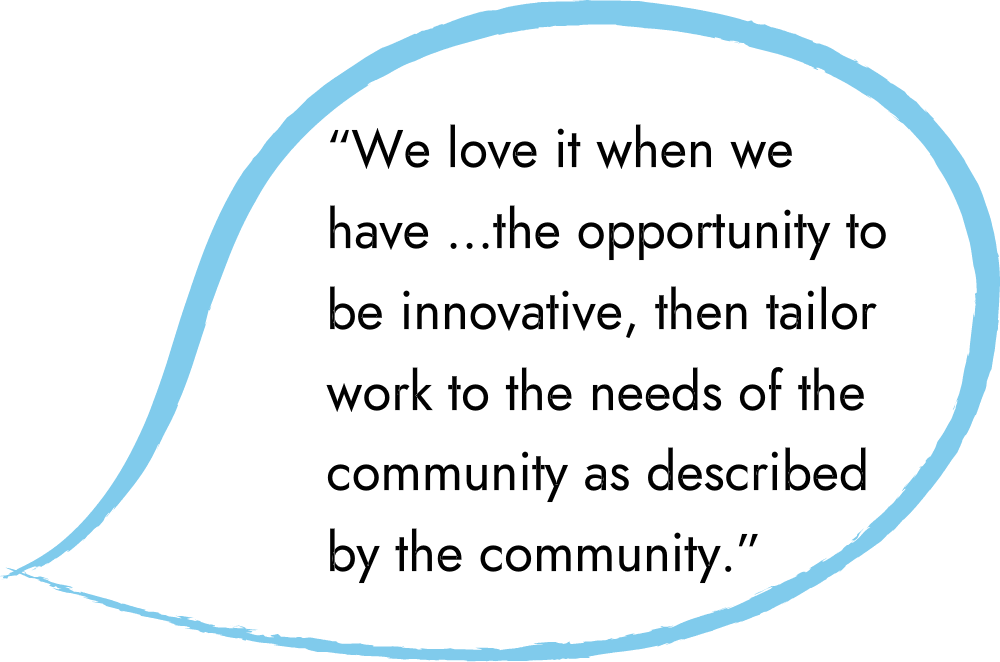
—PHHS Block Grant Coordinator, 2023

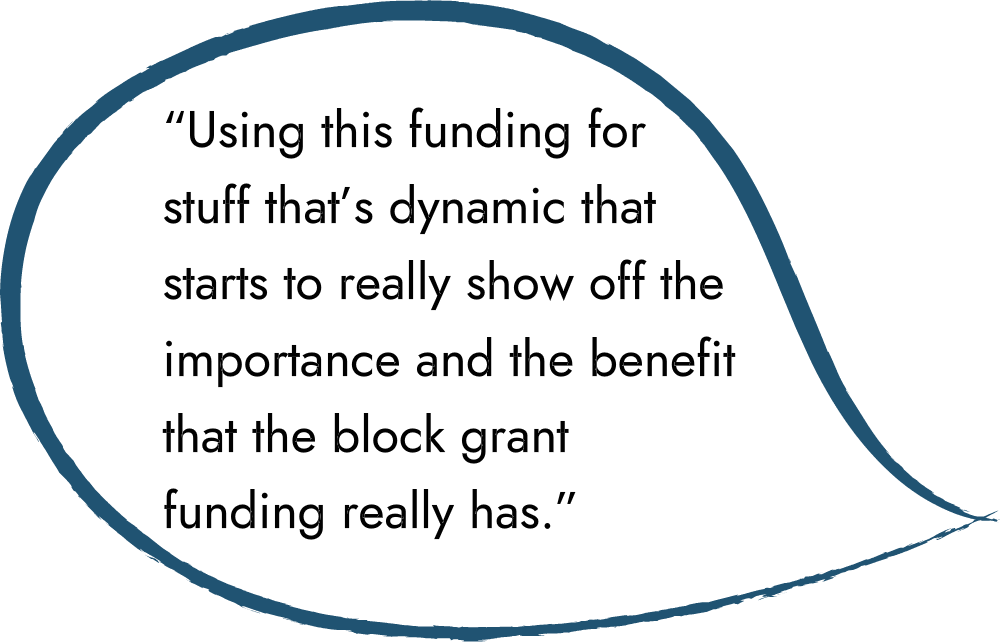
—PHHS Block Grant Coordinator, 2023
Thanks for reading!
You can read more stories about how recipients use the PHHS Block Grant for Innovation, Growth, Community Needs, and Meeting Needs at the links on this webpage.

Footnotes
Source: American Progress. “How Investing in Public Health Will Strengthen America’s Health.” https://www.americanprogress.org/article/how-investing-in-public-health-will-strengthen-americas-health/.
Congressional Research Service. “Federal Grants to State and Local Governments: A Historical Perspective on Contemporary Issues.” https://sgp.fas.org/crs/misc/R40638.pdf.
CDC. “About the PHHS Block Grant Program.” Preventive Health and Health Services (PHHS) Block Grant, May 16, 2024. https://www.cdc.gov/phhs-block-grant/about/index.html.
CDC. “PHHS Block Grant Measures Assessment 2022: Key Findings Report.” https://www.cdc.gov/phhs-block-grant/media/PHHS-Block-Grant-Measures-Assessment-2022-Key-Findings-Report.pdf. Measure 2.1.
CDC. “PHHS Block Grant Measures Assessment 2022: Key Findings Report.” https://www.cdc.gov/phhs-block-grant/media/PHHS-Block-Grant-Measures-Assessment-2022-Key-Findings-Report.pdf. Appendix Table 8.
CDC. “PHHS Block Grant Measures Assessment 2022: Key Findings Report.” https://www.cdc.gov/phhs-block-grant/media/PHHS-Block-Grant-Measures-Assessment-2022-Key-Findings-Report.pdf. Appendix Table 11.
CDC. “PHHS Block Grant Measures Assessment 2022: Key Findings Report.” https://www.cdc.gov/phhs-block-grant/media/PHHS-Block-Grant-Measures-Assessment-2022-Key-Findings-Report.pdf. Measure 3.1.
CDC. “PHHS Block Grant Measures Assessment 2022: Key Findings Report.” https://www.cdc.gov/phhs-block-grant/media/PHHS-Block-Grant-Measures-Assessment-2022-Key-Findings-Report.pdf. Appendix Table 12.
CDC. “PHHS Block Grant Measures Assessment 2022: Key Findings Report.” https://www.cdc.gov/phhs-block-grant/media/PHHS-Block-Grant-Measures-Assessment-2022-Key-Findings-Report.pdf. Appendix Table 15.
Note: This definition is adapted from the Public Health National Center for Innovations and additional input from the environmental scan.
Source: ASTHO. “Flexible Funding to Support Public Health Innovation.” https://www.astho.org/topic/report/flexible-funding-to-support-public-health-innovation/.CDC. “PHHS Block Grant Measures Assessment 2022: Key Findings Report.” https://www.cdc.gov/phhs-block-grant/media/PHHS-Block-Grant-Measures-Assessment-2022-Key-Findings-Report.pdf. Appendix Table 13.
CDC. “PHHS Block Grant Measures Assessment 2022: Key Findings Report.” https://www.cdc.gov/phhs-block-grant/media/PHHS-Block-Grant-Measures-Assessment-2022-Key-Findings-Report.pdf. Appendix Table 14.
CDC. “Funding by Topic Area.” Preventive Health and Health Services (PHHS) Block Grant, May 15, 2024. https://www.cdc.gov/phhs-block-grant/php/data-research/funding-by-topic/index.html.